Rhizometric
with Astrian Zheng (2025 Proof-of-Concept)
Data visualisation
Melbourne, Australia
2026
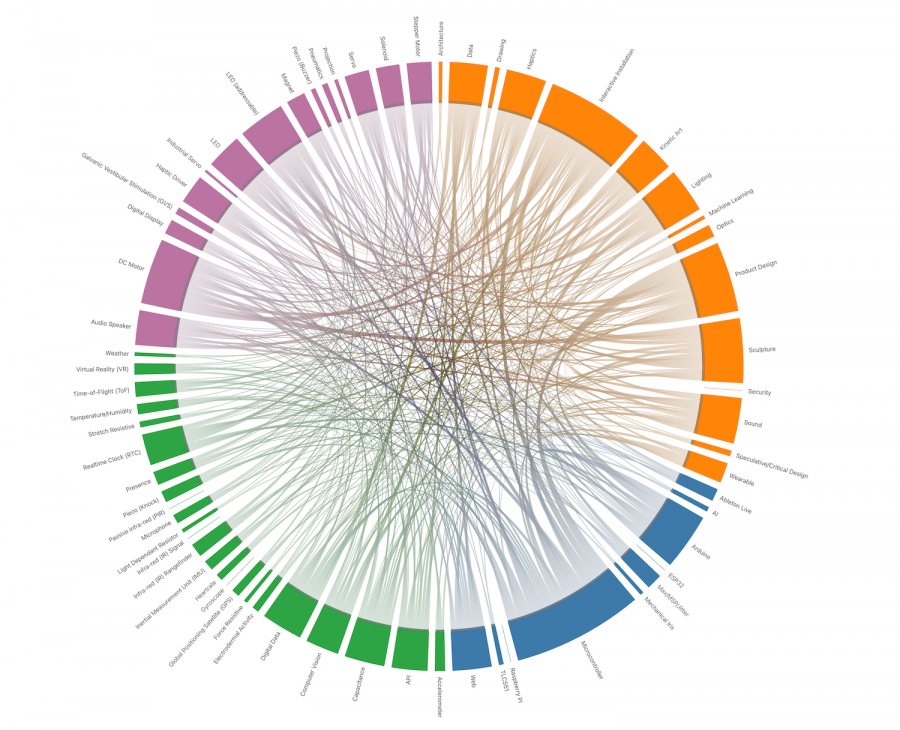
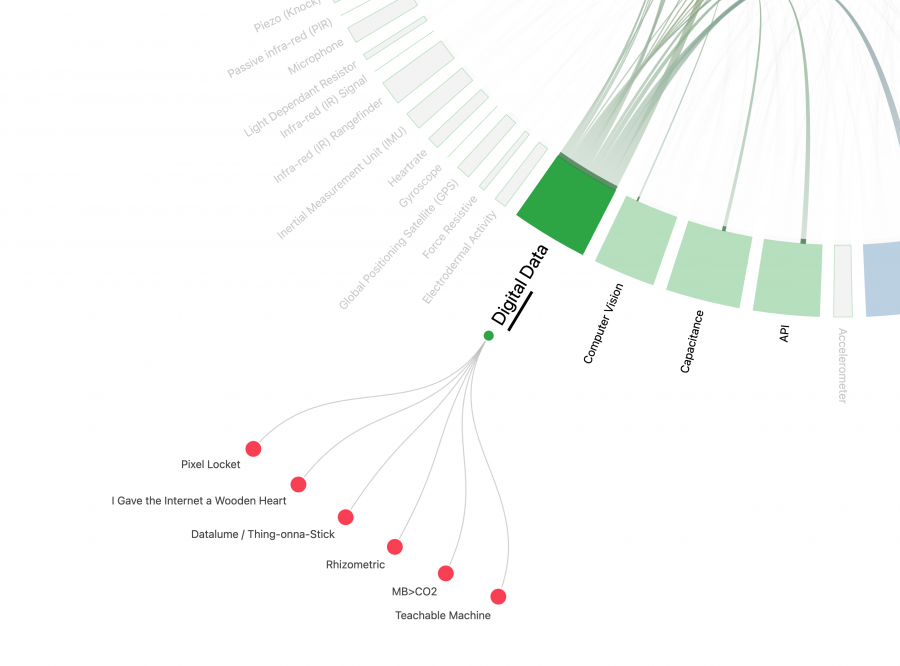
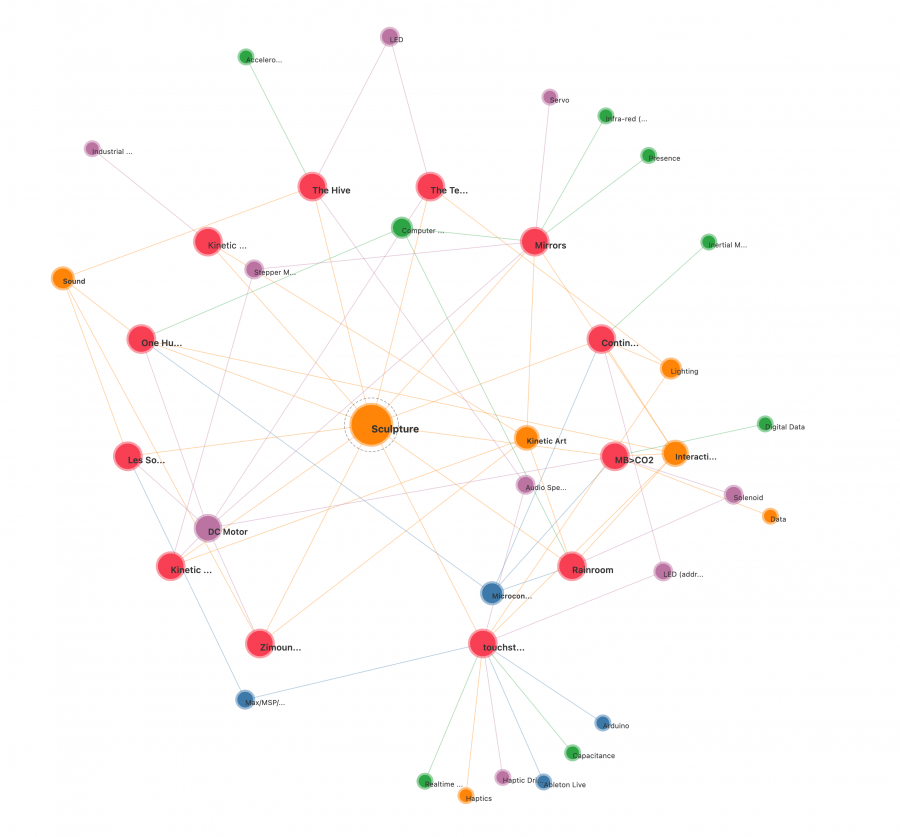
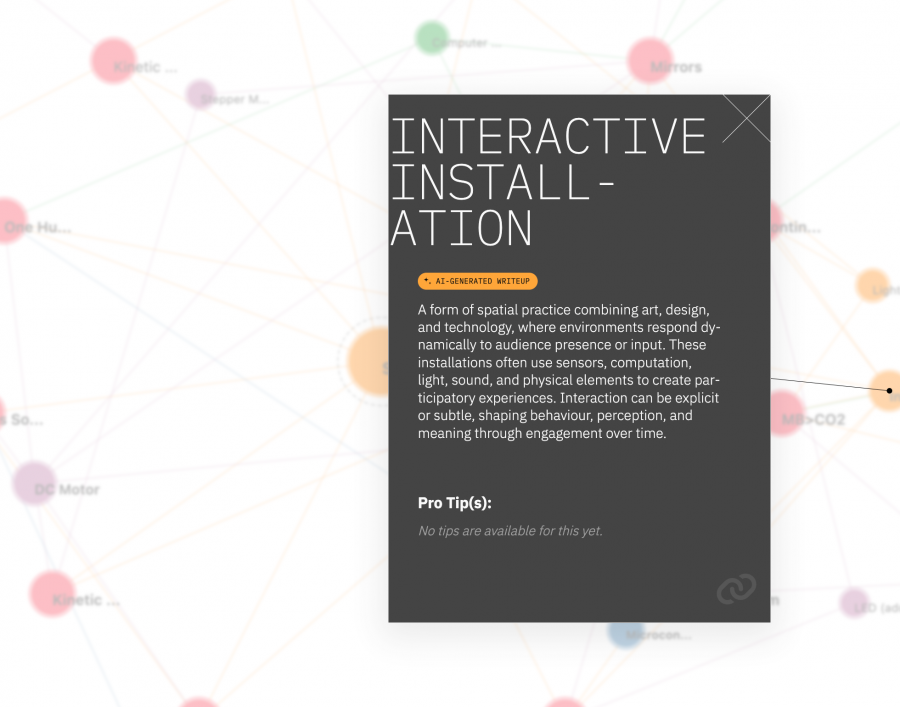
Rhizometric is a browser-based data visualisation engine designed to focus on revealing the connections across a dataset through three different visualisation modes – an integrated Chord+Tree diagram, a Force-directed Network Diagram, and a simpler Tree diagram.
The visualisation was originally designed to supplement a classroom learning environment in Tangible Interaction Design, and in particular, Interactive Technologies. The concept came about to help learners connect different technical topics with a range of precedents, to demystify and widen their horizons in understanding the different ways in which we can prototype and build interactions.
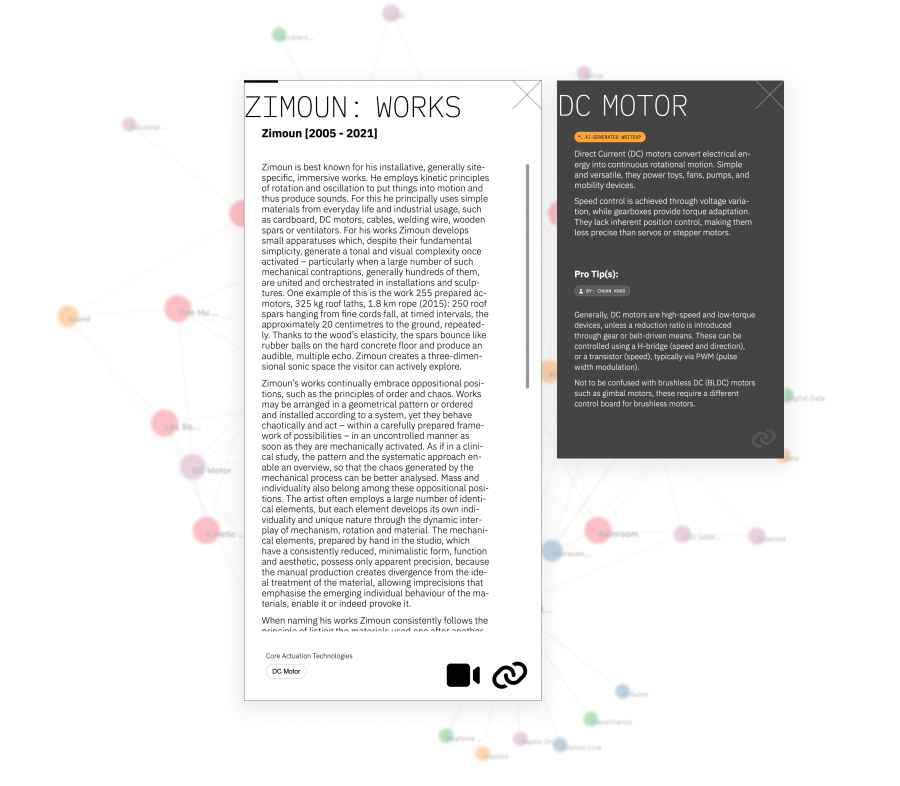
The engine also supports a glossary, and allows the educator to provide additional references and 'pro-tips' to help the learners accelerate their learning process.
As the data is drawn from exported CSVs, spreadsheet applications such as LibreOffice Calc, Google Sheets or Excel can be used to collate the data using a template.
Development of the project in 2026 also involved co-development with Claude Code (Opus 4.7), as part of a reflective study on the future of the designer+developer role (spoiler: it's bright).
The concluding release, v1.2.1, provided a mobile-friendly interface, and implemented a PWA (Progressive Web App) installation for both a mobile and desktop app to be installed for an improved, full-screen experience.
With appreciation to the MADA Educational Experiences Grant for funding the Proof-of-Concept in 2025.
rhizometric.chuank.dev >>